
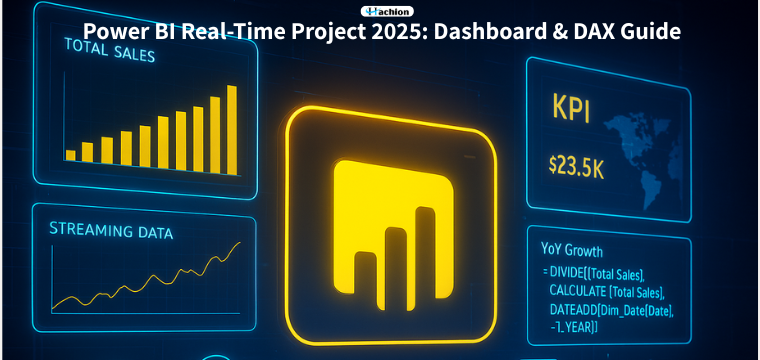
Power BI Real-Time Project 2025: Dashboard & DAX Guide
Power BI remains among the most requested data visualization and business intelligence applications in 2025. As organizations undergo increasing automation, AI-driven analytics, and real-time decision-making, dynamic dashboard building, and optimized DAX formula development, end-to-end Power BI projects have become an essential skill set among IT and analytics professionals.
In case you are planning to take a job position like Power BI Developer, Data Analyst, BI Engineer, or Reporting Analyst, this walkthrough will provide you with the entire picture of what life will be like, from requirements gathering to deployment.
The reason behind the significance of Power BI even in 2025.
AI-Augmented Analytics: Power BI has also gained additional AI capabilities at Microsoft, such as Automated Insights, Copilot to DAX, Smart Narrative, and natural language querying.
Real-Time Dashboards: New technology (IoT, streaming data, and cloud services) demands that companies be able to see dashboards that can change not within hours but within seconds.
Enterprise-Grade Governance: The role of Power BI in enterprise data models is now becoming a significant factor, and there is enhanced security, lineage, and centralized semantic models.
High Demand in the Job Market: By 2025, there will be an increase in Power BI across the healthcare, finance, retail, supply chain, and IT consulting industries.
Real-time Power BI Project Walkthrough
The following is a realistic project scenario, end-to-end, that you can certainly refer to during interviews.
Project Name: Sales and Inventory Real-time Performance Dashboard.
Objective
To allow the business stakeholders to monitor the sales performance, inventory levels, profit margins, and customer behavior of its branches in real time across multiple geographies.
1. Requirement Gathering
Most companies made structured requirement processes in 2025. You should gather:
- Business KPIs
- Data refresh frequencies
- Data sources (ERP, CRM, SQL server, Azure Synapse, Salesforce, Excel, API)
- Security roles (RLS -Row-Level Security)
- Dashboard design requirements.
- Drill-through and drill-down requirements.
- Requirements of mobile views (extremely crucial at this point)
2. Data Sources Used
In the case of a modern real-time dashboard, you can use:
- Azure SQL Database (Primary Sales Data)
- Azure Event Hub / Stream Analytics (Real-time inventory updates)
- SharePoint/Excel Files (Targets, budget, hierarchy)
- Customer feedback or order tracking API REST APIs.
These can be discussed during interviews, and they are widely applied in 2025.
3. Power BI Data Cleaning and Modeling.
Power Query Transformations:
Power Query allows for manipulations and data reshaping within the query itself, without requiring access to the data source to perform any calculations.<|human|>Power Query Transformations, Power Query can perform calculations and manipulations to the data in the query itself, without necessarily having to access the underlying data to do so.
- Removing duplicates
- Standardizing formats
- Creating custom columns
- Merging queries
- Handling missing values
- Introducing incremental refresh of big datasets.
Data Modeling Structure
A proper Star Schema model:
- Fact_Sales
- Fact_Inventory
- Dim_Date
- Dim_Products
- Dim_Customers
- Dim_Region
- Dim_SalesTeam
The relationships are established in a one-to-many way in order to enhance the performance of the DAX.
4. Essential DAX Measures Used
The following are the sample DAX measures you may use in your blog and resume:
- Total Sales
Total Sales =SUM(fact Sales [salesamount])
- Total Quantity Sold
Total Quantity = factor sales sum(Fact Sales(Quantity))
- Profit Margin %
Profit Margin % =
DIVIDE( [Total Sales] - [Total Cost], [Total Sales], 0)
- Year-over-Year Growth
YoY Growth =
DIVIDE( [Total Sales] less CALCULATE( [Total Sales], DATEADD(Dim_Date[Date], -1,YEAR))
DATEADD(Dim_Date[Date], -1, YEAR), 0)<|human|>CALCULATE([Total Sales], DATEADD(Dim_Date[Date], -1, YEAR), 0)
- Real-Time Inventory Status
Inventory Status =
IF( Current Stock) < (Reorder Level), Low Stock, In Stock).
These points indicate your capability to work with sophisticated analytics.
5. Types of visualizations in the Dashboard.
A typical modern Power BI dashboard (2025) will contain:
- KPI Cards (Sales, Margin, Orders)
- Real-time Line Charts (Inventory updates every minute).
- Bar/Column Charts (Performance in product category)
- Map Visuals (Geo-based sales)
- Root-cause analysis (Decomposition Tree).
- Smart Narrative AI Summary
- Drill-through Pages (Product level insights)
- Bookmarks & Storytelling
6. Deployment & Data Refresh Configuration.
Power BI Service Steps: Publish the report to the workspace
Option 1: configure Gateway (on-premise data)
- Set up the Streaming Dataset for real-time data.
- Install automatic refresh (after 30 hours, or daily)
- Install Row-Level Security.
- Share or SharePoint with Teams.
Power BI Interview Tips for 2025
1. Be strong in DAX: DAX questions based on scenarios are now tested by companies.
2. Master data modeling: Star schema, fact/dimension tables, cardinality, relationship types.
3. Understand how to exploit big data: The basics of Performance Analyzer and DAX Studio.
4. Be familiar with AI features: In Power BI, GPT-powered Copilot is one of the big topics of interviews in 2025.
5. Understand real-time streaming and incremental refresh: These are common questions that are asked.
6. Should possess at least one end-to-end project description: The above walkthrough is an ideal interviewing tool.
FAQS
1. What is Power BI primarily used for in 2025?
A: Power BI is applied in interactive dashboards, AI-driven insights, real-time reporting, enterprise data modeling, and decision automation.
2. Is Power BI able to process real-time data?
A: Yes. Power BI allows streaming datasets and DirectQuery, Event Hub, and Azure Stream Analytics to be used in real-time dashboards.
3. Is Power BI still in demand in 2025?
A: Definitely- Power BI jobs keep on increasing as a result of cloud usage and the necessity of making decisions based on facts.
4. What are the skills needed to work with a Power BI job?
A: Knowledge in DAX, Data modeling, SQL, Power Query (M), visualization design, and Power BI service.
5. In what ways do I train real-time Power BI projects?
A: Get FREE Azure (Event Hub, SQL DB), open APIs, or take up employment training courses.
6. What is the duration to be learned in Power BI?
A: Basic knowledge may be acquired by beginners within 3-4 weeks, and real-time dashboards may be developed with practice within 6-8 weeks.
7. Will Power BI be superior to Tableau in 2025?
A: The reason why Power BI prevails is its lower price, integration with Microsoft, and AI capabilities.
Conclusion
Power BI of 2025 is even smarter, faster, and more AI-driven than ever. With knowledge in DAX, data modeling, real-time dashboard, and deployment, you will be prepared to take any interview with Power BI in the contemporary market. In case you desire to receive structured, practical training with real-time projects:
Sign up for the Hachion Power BI Training Program and acquire employable skills in 2025.


